
Boardgame Empire | Where board gaming, astronomy, science, science fiction and fantasy meet.
by Mike Clarke
With files from NASA and the NOAA
It’s official. Last year was the warmest on Earth since record keeping began 135 years ago in 1880.
The announcement Friday, Jan 16, follows two separate analyses by NASA and the National Oceanic and Atmospheric Administration (NOAA ).
It’s the third time in a decade, the Earth has set a new global temperature record.

Earth broke NOAA records set in 2010 and 2005. The last time the Earth set an annual NOAA cold record was in 1911.
“The 10 warmest years in the instrumental record, with the exception of 1998, have now occurred since 2000,” said NASA in its release. “This trend continues a long-term warming of the planet.”
NASA said global temperatures have increased by 1.4 degrees since 1880, which may not seem like much, but is significant according to climatologists.
This trend is largely driven by the increase in carbon dioxide and other human emissions into the planet’s atmosphere,” NASA said in its report. “The majority of that warming has occurred in the past three decades.”
“The globe is warmer now than it has been in the last 100 years and more likely in at least 5,000 years,” said climate scientist Jennifer Francis of Rutgers University. “Any wisps of doubt that human activities are at fault are now gone with the wind.”
In 2011, a National Academy of Science report found each degree C of global temperature increase in North America can be expected to produce:
• 5-10% changes in precipitation across many regions
• 3-10% increases in the amount of rain falling during the heaviest
precipitation events
• 5-10% changes in streamflow across many river basin
• 15% decreases in the annually averaged extent of sea ice across
the Arctic Ocean, with 25% decreases in the yearly minimum
extent in September
• 5-15% reductions in the yields of crops as currently grown
• 200-400% increases in the area burned by wildfire in parts of the
western United States
The report found that the release of carbon dioxide in the atmosphere from the burning of fossil fuels, former life on the planet that has lain dormant for eons, could cause warming that will be irreversible for the next 1,000 years.
This video shows a time series of five-year global temperature averages, mapped from 1880 to 2014, as estimated by scientists at NASA’s Goddard Institute for Space Studies (GISS) in New York.
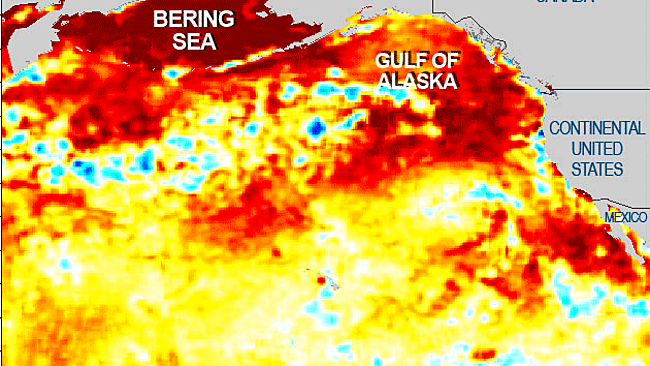
Drastic warming of North Pacific Ocean
In December, the NOAA warned rising temperatures in the normally chilly North Pacific Ocean was fueling the global warming trend.
Ocean surface temperatures in the North Pacific spanning the Gulf of Alaska all the way to Japan were three to four degrees above average last year, far beyond any recorded value resulting in a shift northward in invasive marine species and a disruption of the marine food chain.
“This is the latest in a series of warm years, in a series of warm decades,” said Gavin Schmidt, the director of the Goddard Space Institute for Space Studies
“While the ranking of individual years can be affected by chaotic weather patterns, the long-term trends are attributable to drivers of climate change that right now are dominated by human emissions of greenhouse gases.”
Scientists expect to see year-to-year fluctuations in average global temperatures caused by many factors including El Niño or El Niña, currents that warm or cool the tropical Pacific. However, NASA said this year’s record occurred in an EL Niño-neutral year, with no assistance from the ocean warming current.
The GISS global temperature analysis incorporated surface temperature measurements from 6,300 weather stations, ship- and buoy-based observations of sea surface temperatures, and temperature measurements from Antarctic research stations, NASA said.
The research was supported from land, air and space with a fleet of satellites, as well as airborne and ground-based observation campaigns.
The data set of 2014 surface temperature measurements is available at: http://data.giss.nasa.gov/gistemp/
The methodology used to make the temperature calculation is available at: http://data.giss.nasa.gov/gistemp/sources_v3/